Lynda - Excel 2007: Creating Charts with Dynamic Data
This post was published 10 years ago. Download links are most likely obsolete. If that's the case, try asking the uploader to re-upload.
Lynda - Excel 2007: Creating Charts with Dynamic Data
MP4 | Video: 960x600 | 127 kbps | 48 KHz | Duration: 40m 47s | 88 MB
Genre: eLearning | Language: English
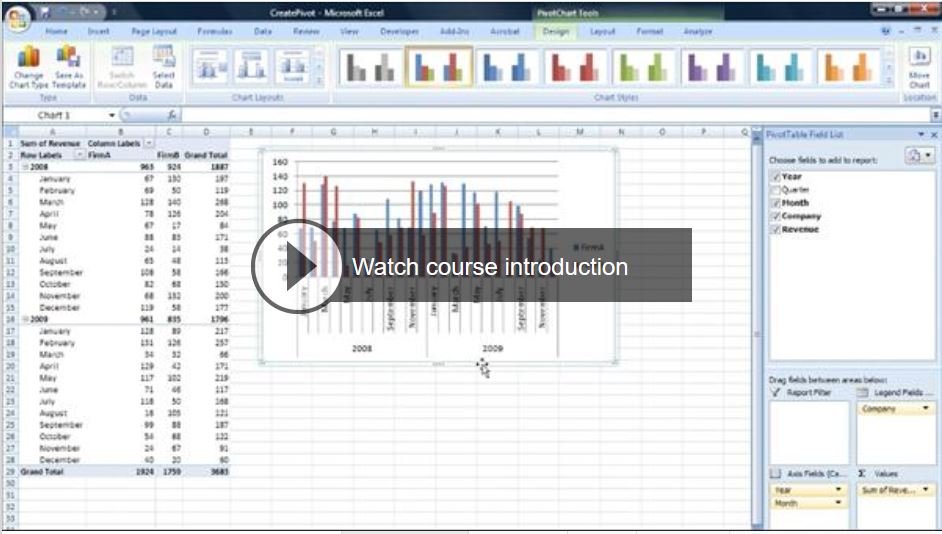
Excel 2007: Creating Charts with Dynamic Data shows how simple data in Excel can be used to build exciting and updatable charts. Microsoft Most Valuable Professional Curt Frye explains how to use both named ranges and Excel tables to create charts that adjust as the data changes. Curt demonstrates how to specify the number of points in a chart and how to use a drop-down list to select which data series is displayed. Finally, he shows how to use PivotChart reports to reorganize and visualize data on the fly. Exercise files accompany the course.
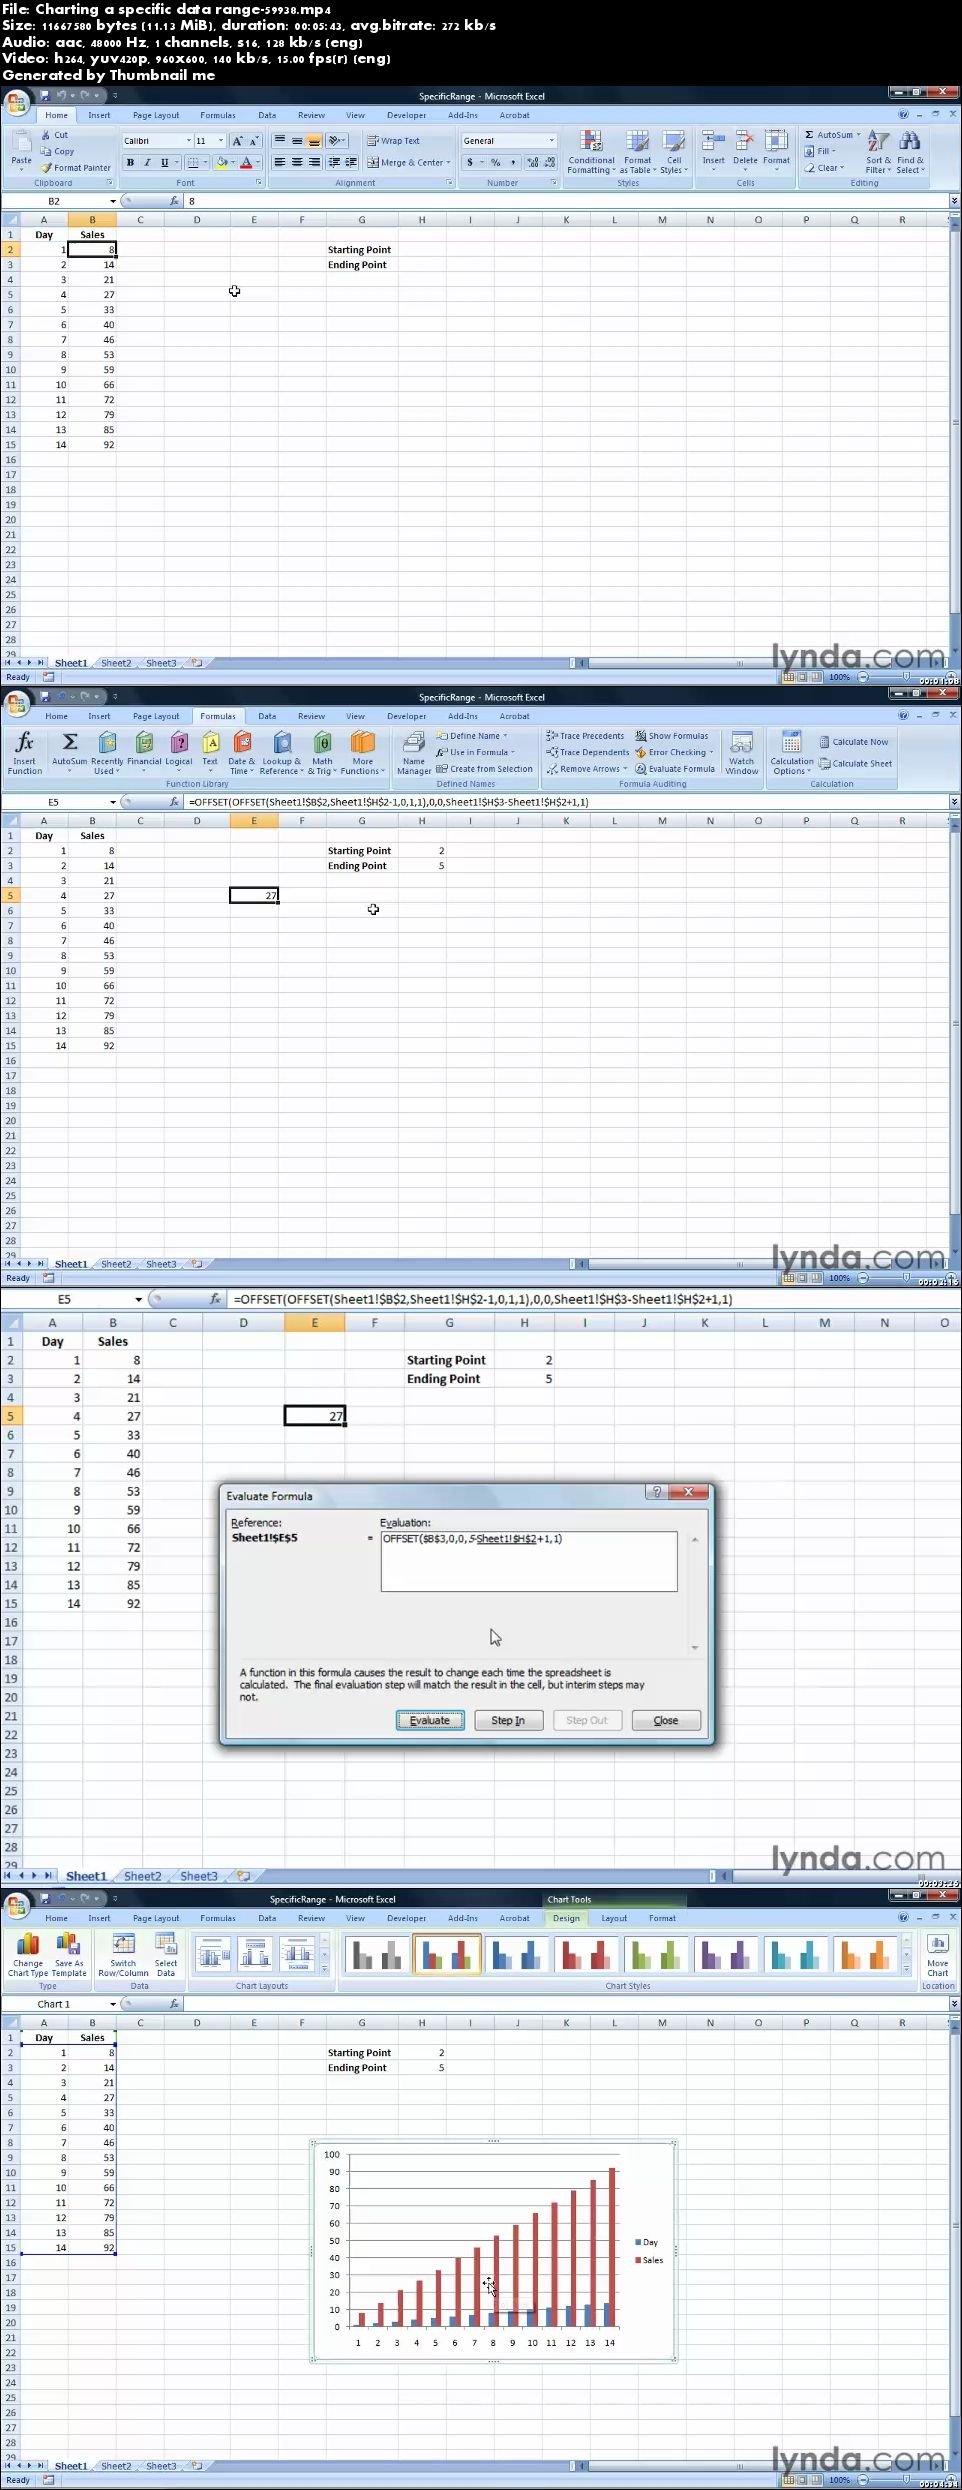
Screenshots
Screenshots

Password: sanet.me


http://nitroflare.com/view/337450CFC071EDE/SAnet.me.Excel.2007.Creating.Charts.with.Dynamic.Data.rar
.
.
.
~~~~ Welcome to my Blogs ~~~~
Do not forget to check it every day!
If You should find any files not found, please PM me

DownloadDownload: Software, Video Training

Ebook - Snorgared: Best Ebooks

Graphic World: Best Graphics

Android SAnet.me Collection Pack by Snorgared < Update Daily >