Xcode Developer Tools in iOS (Feb. 2018)
This post was published 8 years ago. Download links are most likely obsolete. If that's the case, try asking the uploader to re-upload.
MP4 | Video:1280x720 | Duration: 1h 4m | 212 MB
Genre: eLearning | Language: English | Level: Intermediate
Bugs and performance issues inevitably come up during coding. Xcode 9 has some great new tools for finding and fixing these issues. In this course, learn how to leverage the new Xcode developer tools to enhance your debugging workflow. First, learn what's new in Xcode 9, including refactoring tools like fix-its, wireless debugging, GitHub integration, and multiple concurrent simulators. Instructor Jon Bott also covers auditing your app for accessibility, determining the location of memory issues, and troubleshooting performance issues with threads. Plus, he explains how to debug view hierarchies to solve UI issues during runtime, and how to discover memory leaks.
Topics include
Working with the Accessibility Inspector
Reviewing dynamic text and audit fixes
Using the Memory Debugger
Using the Thread Sanitizer
Debugging view hierarchies
Analyzing a project for memory consumption
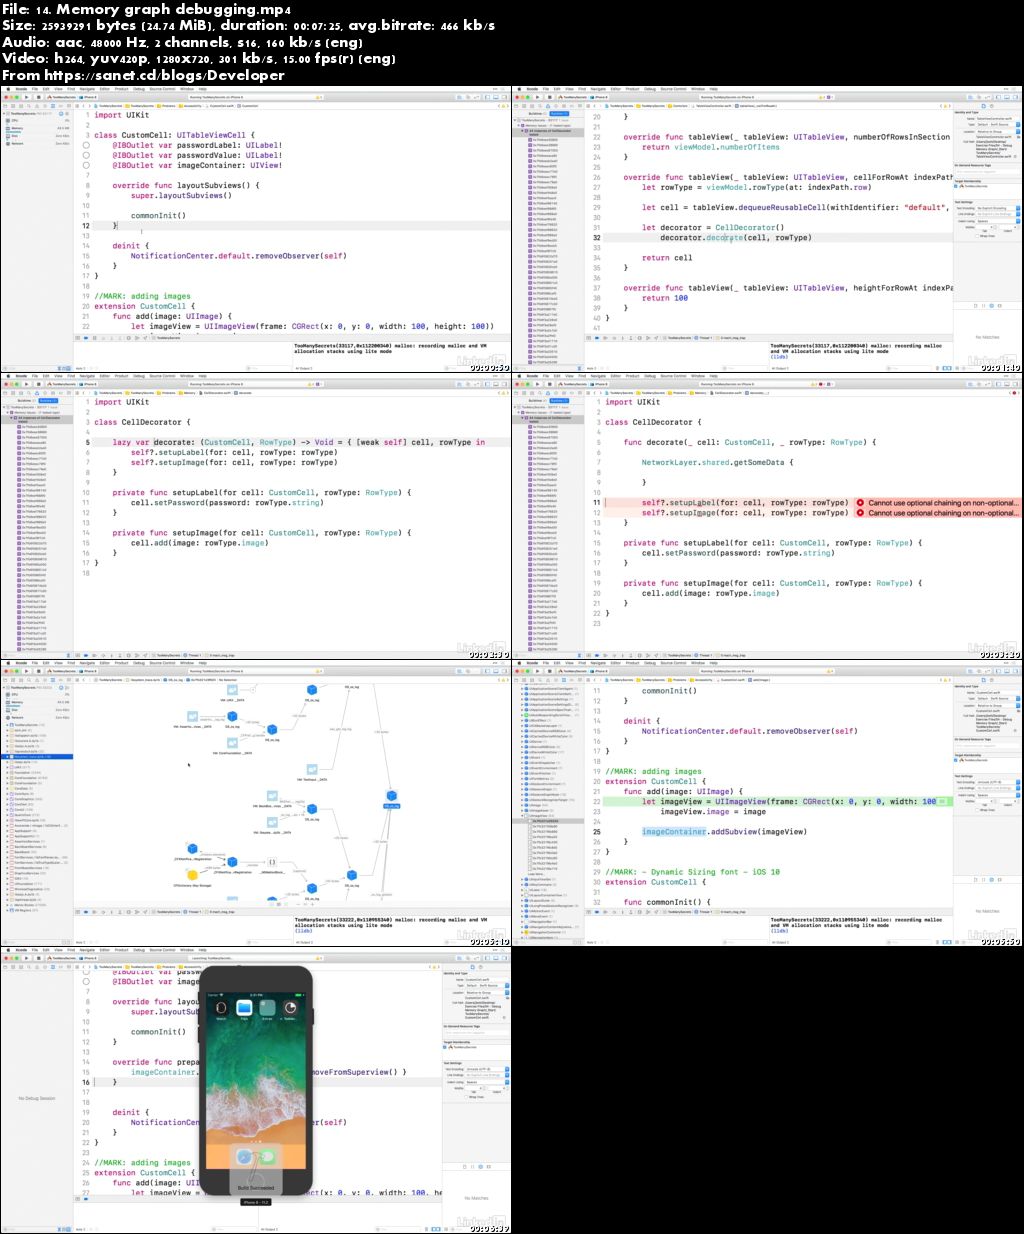
Screenshots
Quick check before we show the links
Helps us keep automated scrapers from hammering the filehosts.